Hardware
Photos
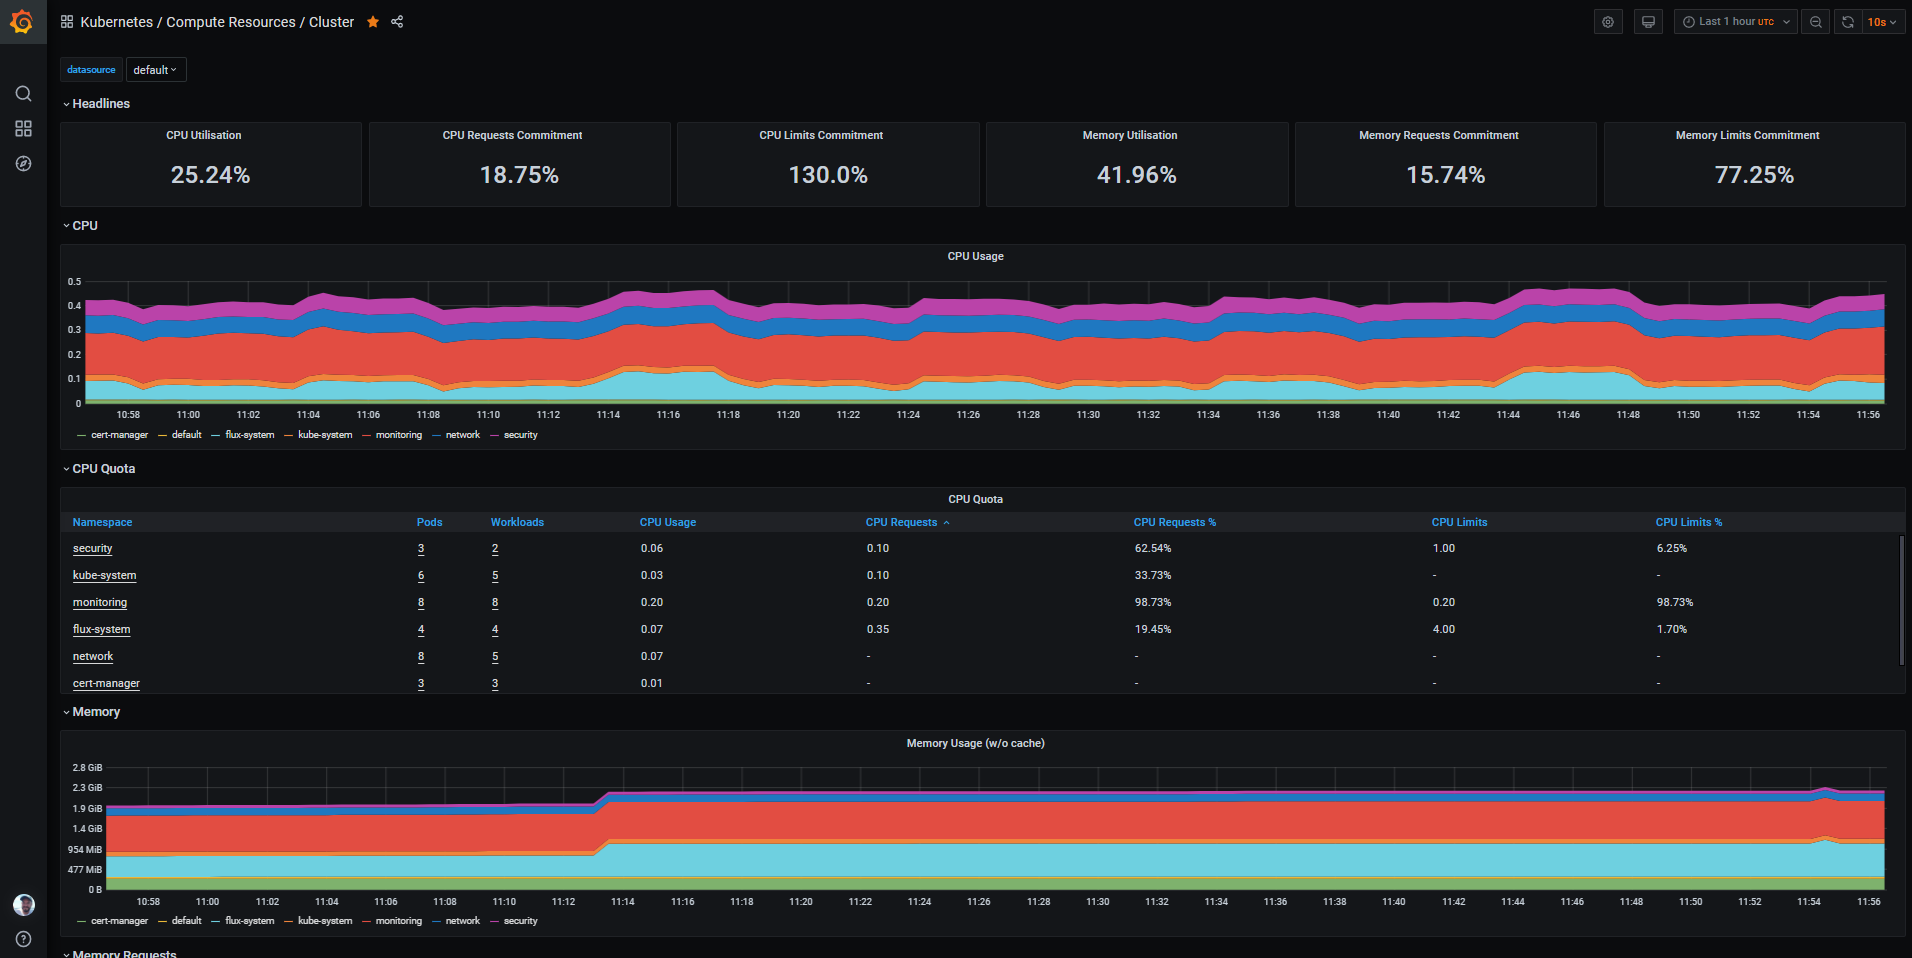
A Grafana dashboard form my Home Lab.
Systems
M4 Macbook Air
- Apple M4 10 Core CPU@4.4 GHz
- 16GB Unified Memory LPDDR5@7500MHz
- 16-core Neural Engine
- 256GB SSD
$ disktest /tmp

...
Testing cached reads...
Timing cached reads:   4096 MB in  0.25 seconds = 16489.01 MB/sec
Testing mounted volume performance...
Using mount point: /System/Volumes/Data
Testing write performance...
Timing buffered disk writes: 1024 MB in  1.87 seconds = 548.42 MB/sec
Testing read performance...
Timing buffered disk reads:  1024 MB in  0.36 seconds = 2816.55 MB/sec
Budget Build Desktop
I’ve love value builds.
- AMD Ryzen 5 5500X 6 Core@3.6-4.2GHz
- Corsair Vengeance LPX 16GB (2x8GB) DDR4@2666MHz
- Samsung 960 EVO 250GB SSD NVMe
- Asus Strix RX570@1300MHz (2048SP) 4GB DDR5@7000MHz
$ hdparm -Tt /dev/sda

/dev/sda:
 Timing cached reads:   18744 MB in  2.00 seconds = 9381.70 MB/sec
 Timing buffered disk reads: 5822 MB in  3.00 seconds = 1940.50 MB/sec
Home Lab
I use this compact and low power Intel NUC to run docker workloads with gitops. I use this primarily for media, storage, and monitoring.
- Intel i3-4010U 2 Core@1.7GHz
- Corsair 8GB (1x8GB) DDR3@1600MHz
- Micron M600 128GB SSD mSATA
$ hdparm -Tt /dev/sda

/dev/sda:
 Timing cached reads:   7664 MB in  1.99 seconds = 3854.47 MB/sec
 Timing buffered disk reads: 1348 MB in  3.00 seconds = 448.90 MB/sec
VPCs
I have workloads running in both AWS and GCP. I use these for work related experiements, testing best practices, and creating examples e.g. CI, CD, IAM, and networking patterns.
$ yum install python python-pip -y \
 && pip install --upgrade pip \
 && pip install speedtest-cli \
 && speedtest-cli

Download: 3283.42 Mbit/s Upload: 2274.26 Mbit/s